Cyber Lab · Case study
Elastic SIEM + MISP
A dedicated Elastic SIEM for my lab: Filebeat ships host logs from every Proxmox node over TLS, automation events land in their own index, and MISP adds threat intelligence, all so I can investigate the way a SOC analyst does.
- 3Proxmox nodes shipping logs with Filebeat
- 2Log streams: host logs and automation events
- 4 GBElasticsearch heap cap for stability
- 1Dedicated SIEM VM (Elasticsearch + Kibana 8)
Why I built it
A SOC analyst's day happens in a SIEM. Instead of only reading about one, I run my own: real logs from real machines, so I can search, pivot and investigate activity in my lab, and tell what my own automation did from what something else did.
The pipeline
- Collect. Standalone Filebeat on each of the three Proxmox nodes reads host logs.
- Ship. Filebeat sends straight to Elasticsearch over HTTPS. No Fleet server or extra agents are needed for a lab this size.
- Store. A dedicated VM runs Elasticsearch and Kibana 8. Host logs and automation events live in separate indices (
filebeat-*andn8n-events), each with its own data view. - Enrich. MISP provides threat-intel feeds and IOC lookups for suspicious IPs and domains.
- Investigate. Kibana Discover and dashboards are where I search by host, severity and time, and pivot between related events.
Design decisions
- Standalone Filebeat over Elastic Agent and Fleet. Fewer moving parts and fewer services to secure. Each node ships directly over TLS, and adding a node is one config file.
- A separate index for automation. Every action my n8n workflows take (restarts, update runs, repairs) is written to its own index. When I see a service restart, I can check in seconds whether my watchdog did it or something else did. That's the same question an analyst asks: expected change or incident?
- Capped JVM heap. Elasticsearch takes a large share of RAM by default. Capping the heap at 4 GB keeps the SIEM VM stable alongside the rest of the cluster.
Problems I solved
- Nodes not shipping logs. Two nodes weren't sending anything. I traced it to Filebeat configuration and file-permission problems on those hosts, not the SIEM.
- Resource contention. The heap cap fixed instability caused by Elasticsearch competing with other VMs for memory.
How it fits the bigger picture
This SIEM sits beside the detection and triage features of my Securxlab dashboard, which add custom detection rules, MITRE ATT&CK mapping and an alert queue. Together they cover the analyst loop: collect → detect → triage → investigate → respond.
Skills demonstrated
SIEM deployment · log pipeline design · Elasticsearch and Kibana · Filebeat · index and data-view design · threat-intel enrichment (MISP) · troubleshooting · correlating automation with security events
What's next
- Write detection rules as code (Sigma) with test cases and an ATT&CK coverage map.
- Forward Elastic alerts into the Securxlab alert queue.
- Ship guest logs (Windows event logs, Sysmon) for richer detections.
More projects
All projects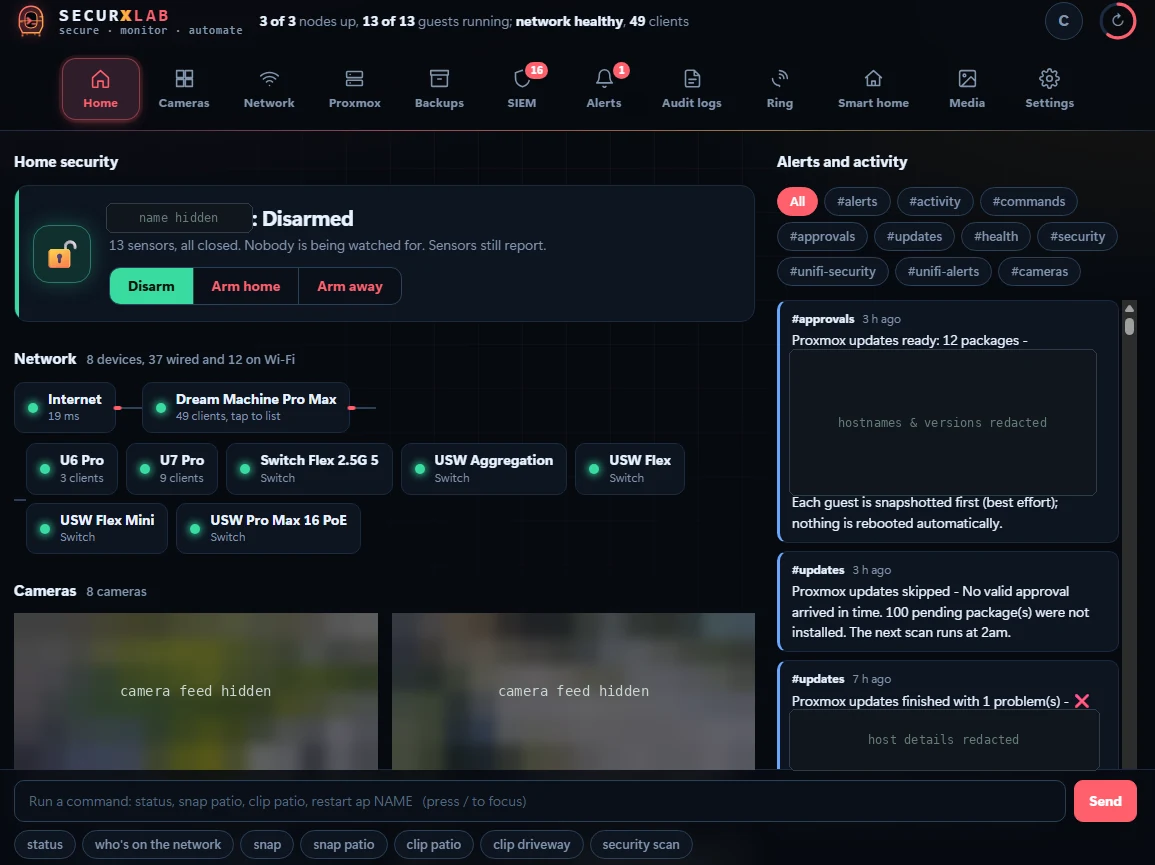 Homelab
Securxlab — Homelab SOC & Self-Healing Command Center
A self-built security operations dashboard for my homelab: SIEM with MITRE ATT&CK-mapped detections, alert triage and threat intel, plus Proxmox, UniFi and camera control, all driven by n8n automation with human-in-the-loop approvals.
Proxmox VEn8nElastic SIEMUniFi+5
3-Node Proxmox Cluster
The foundation of my lab: a three-node Proxmox VE cluster running my SIEM, automation, web and home services as VMs and containers, with approval-gated patching, a self-healing watchdog and key-only SSH.
Proxmox VEKVMLXCDocker+5
n8n + Discord Ops Bot
AI-assisted n8n workflows that watch my Proxmox cluster around the clock: they restart failed guests, scan for updates and wait for my approval, diagnose errors with an LLM, and report through the dashboard, with Discord as the fallback.
n8nProxmox APIOllama (llama3)Claude API+5